
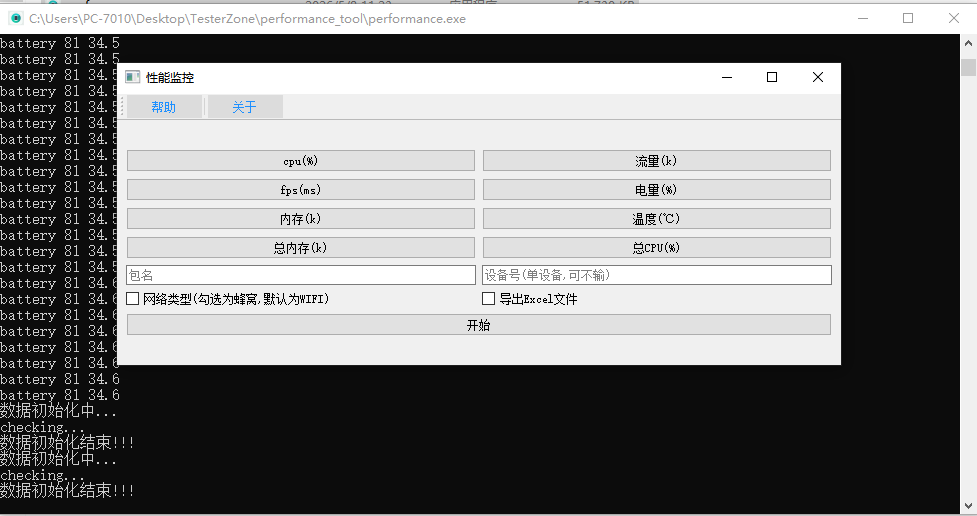
Tool Introduction
The Performance Monitoring Tool collects runtime data through ADB/HDC system commands. It supports CPU, FPS frame timing, memory, network traffic, battery level, temperature, total memory, total CPU, and current foreground page metrics. Testers enter a package name to start continuous sampling and can export the results as an xls file. The tool is designed for focused observation on a connected or specified device, with results derived from system shell output; it does not implement automated diagnosis or server-side reporting.
Key Features
Continuously samples selected metrics including CPU, FPS frame timing, memory, traffic, battery, temperature, total resources, and current page.
Checks adb devices and hdc list targets before startup and selects the available collection implementation.
Exports headered xls files after sampling stops for test records.
Testing Scenes
- Observe app CPU, memory, frame timing, and network changes during manual or focused testing.
- Compare performance changes before and after a page or operation while recording the current Activity.
- Inspect app traffic, app network speed, and total network speed under Wi-Fi or cellular scenarios.
- Export sampled results to an xls file for test records and later analysis.
Environment & Requirements
- Platform
- Windows desktop; test targets include Android devices connected through ADB and HarmonyOS/OpenHarmony-style devices connected through HDC.
- System Range
- On Android, the tool reads ro.build.version.sdk and includes Android 10+ handling for total memory. On HDC targets, the code can read the system version, but no explicit supported version range is exposed in the UI.
- Access Path
- Users enter the app package name and optional device serial in a PyQt5 GUI. The tool auto-detects adb devices or hdc list targets before sampling.
- Package
- performance.exe
Permissions & Dependencies
- The PC side requires Python/PyQt5, tablib, and a usable adb or hdc command-line tool.
- The device must allow debugging connections and ADB/HDC shell commands.
- App-level metrics require the package name to match a running process.
- Excel export relies on tablib's xls export support.
Support Notes
Explicitly Supported
- package.py explicitly supports the performance packaging entry, mapped to performanceGui.py.
- performanceGui.py exposes CPU, FPS, memory, network, battery, temperature, total memory, and total CPU options.
- The ADB path uses dumpsys battery, dumpsys meminfo, dumpsys gfxinfo, top, /proc/net/dev, and dumpsys activity.
- The HDC path uses hidumper BatteryService, /proc/meminfo, /proc/<pid>/statm, /proc/net/dev, SP_daemon, and aa dump.
- Exported files use the -performance.xls suffix.
Reasonable Inference
- The tool is mainly intended for physical or ADB/HDC-detectable test devices connected from Windows.
- Because sampling is based on system commands, metric accuracy may vary by OS version, vendor implementation, and permission policy.
- Metrics can be selected on demand, avoiding unrelated data collection in each test.
- A single entry point can automatically choose ADB or HDC data paths for Android and HarmonyOS/OpenHarmony-style devices.
- The sampling table marks foreground pages outside the target package, helping identify app-switching during tests.
Download & Trust
- Package
- EXE
- Size
- 50.5 MB
- Updated
- 2026-06-02
- Download
- Sign in Required
This self-developed tool is built for real Android app QA workflows, runs locally, and does not depend on an external testing platform.