Tool Introduction
This tool is aimed at Android testers. After a user selects an installed app on the device, it continuously collects process-memory and Activity information through ADB shell commands such as pidof, ps, dumpsys meminfo, and dumpsys activity activities, then shows live PSS, Private Dirty, Activity-in-memory, and Activity-in-stack values in a floating window. Once recording starts, the tool writes a session summary and per-sample details into a local database. If the target app is debuggable, the tool can also trigger GC before the session ends, run am dumpheap -g to capture an HPROF file, and use Shark plus LeakCanary to analyze destroyed Activities and removed or detached Fragments in the heap. Outputs include a local report list, per-sample leak details, shareable or exportable HPROF files, and the tool's own log files. The code does not show cloud sync, automated fixes, or cross-platform support, so this is better suited to Android-focused manual testing, regression checks, and reproduction work than to a general APM platform.
Key Features
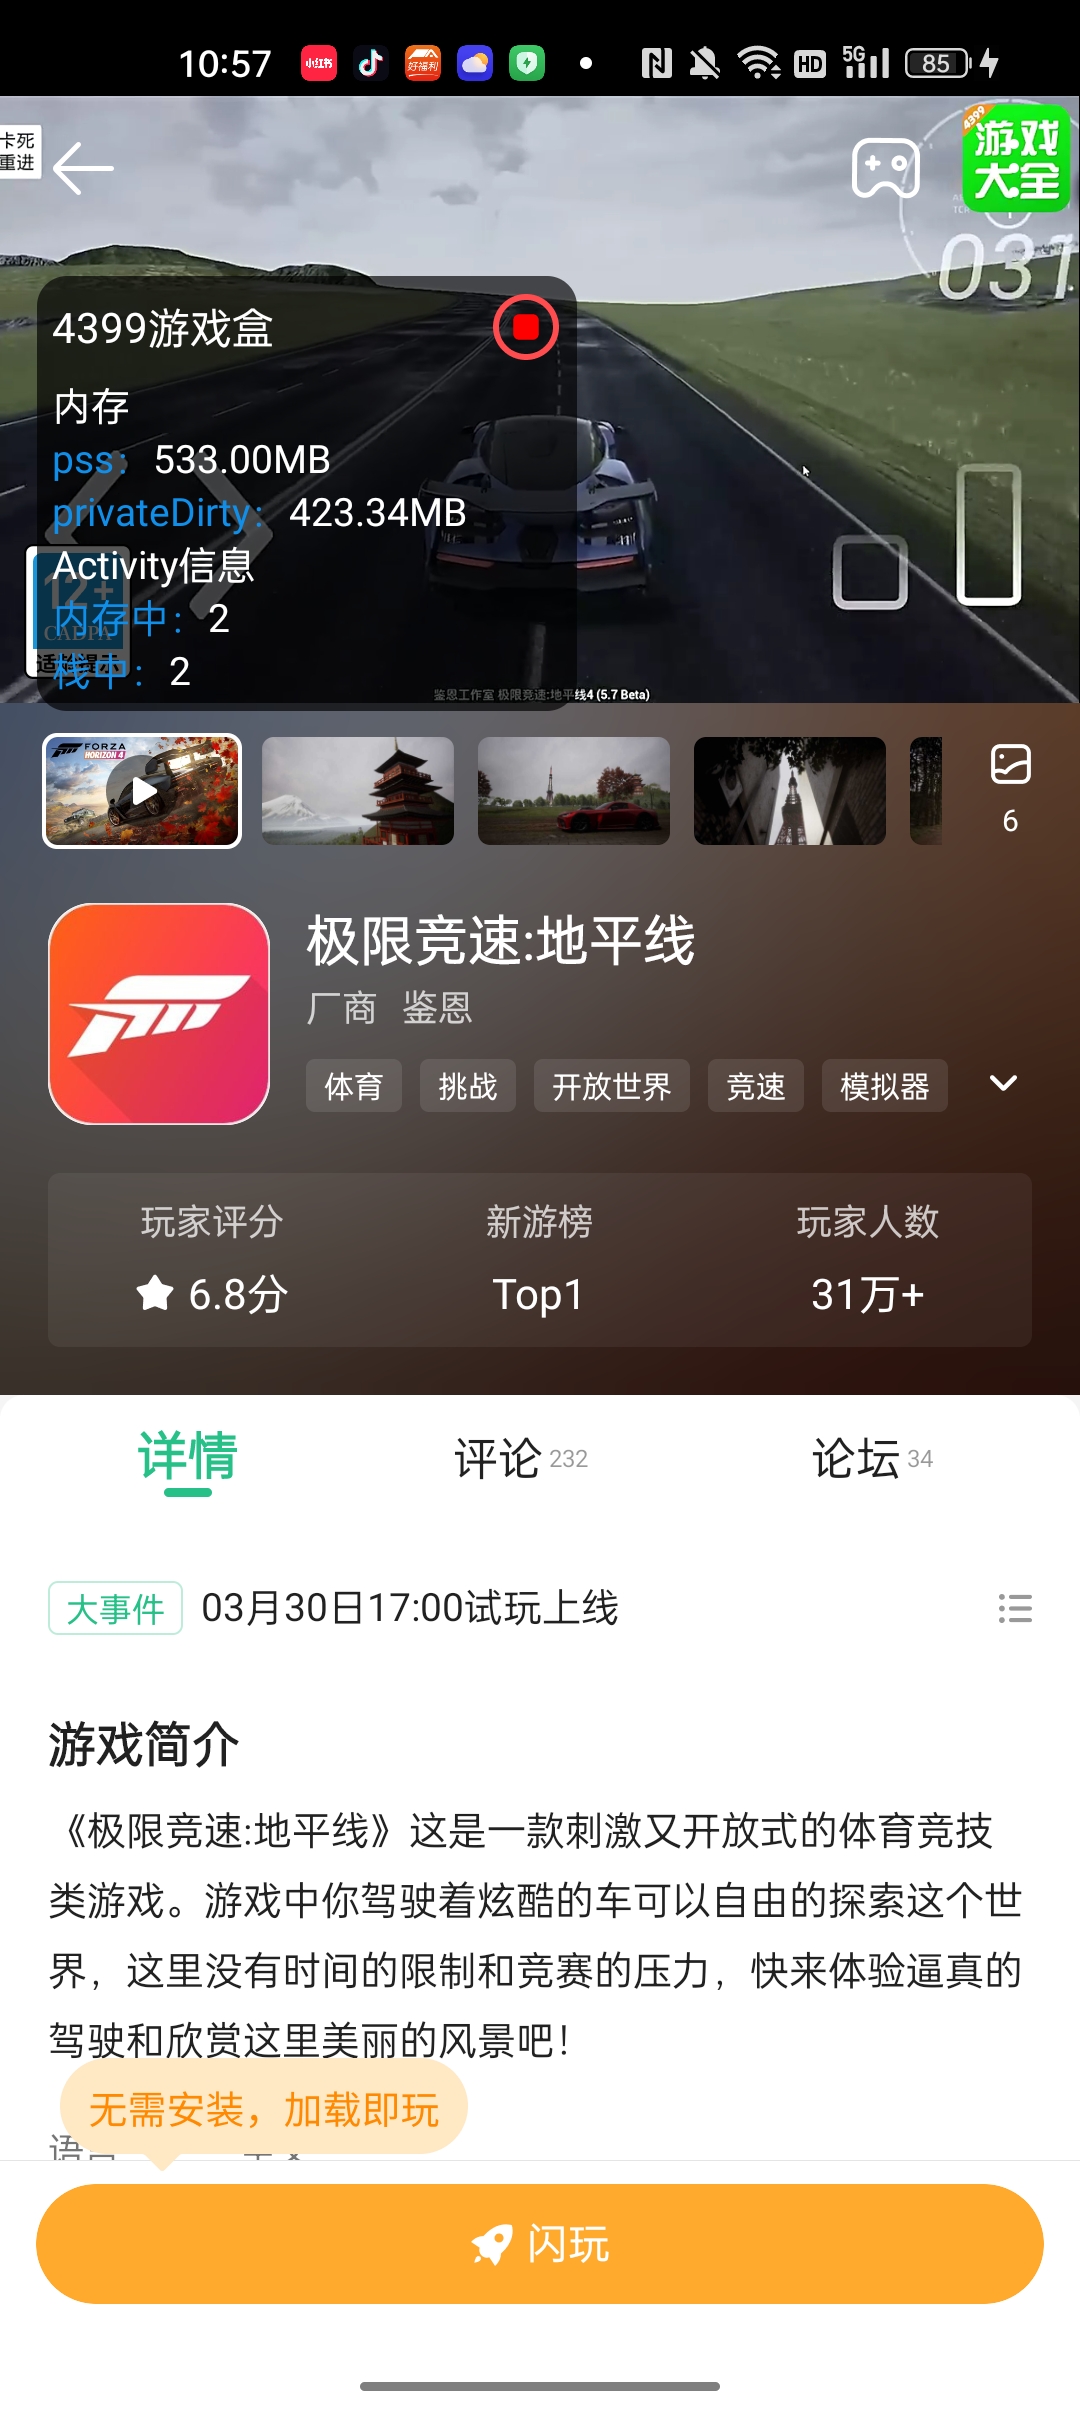
Periodically runs dumpsys meminfo and dumpsys activity activities through ADB shell to refresh PSS, Private Dirty, Activities in memory, and Activities in the stack.
For debuggable targets, the tool can trigger GC, capture an HPROF file, and analyze destroyed Activities plus removed or detached Fragments with custom Shark and LeakCanary leak filters.
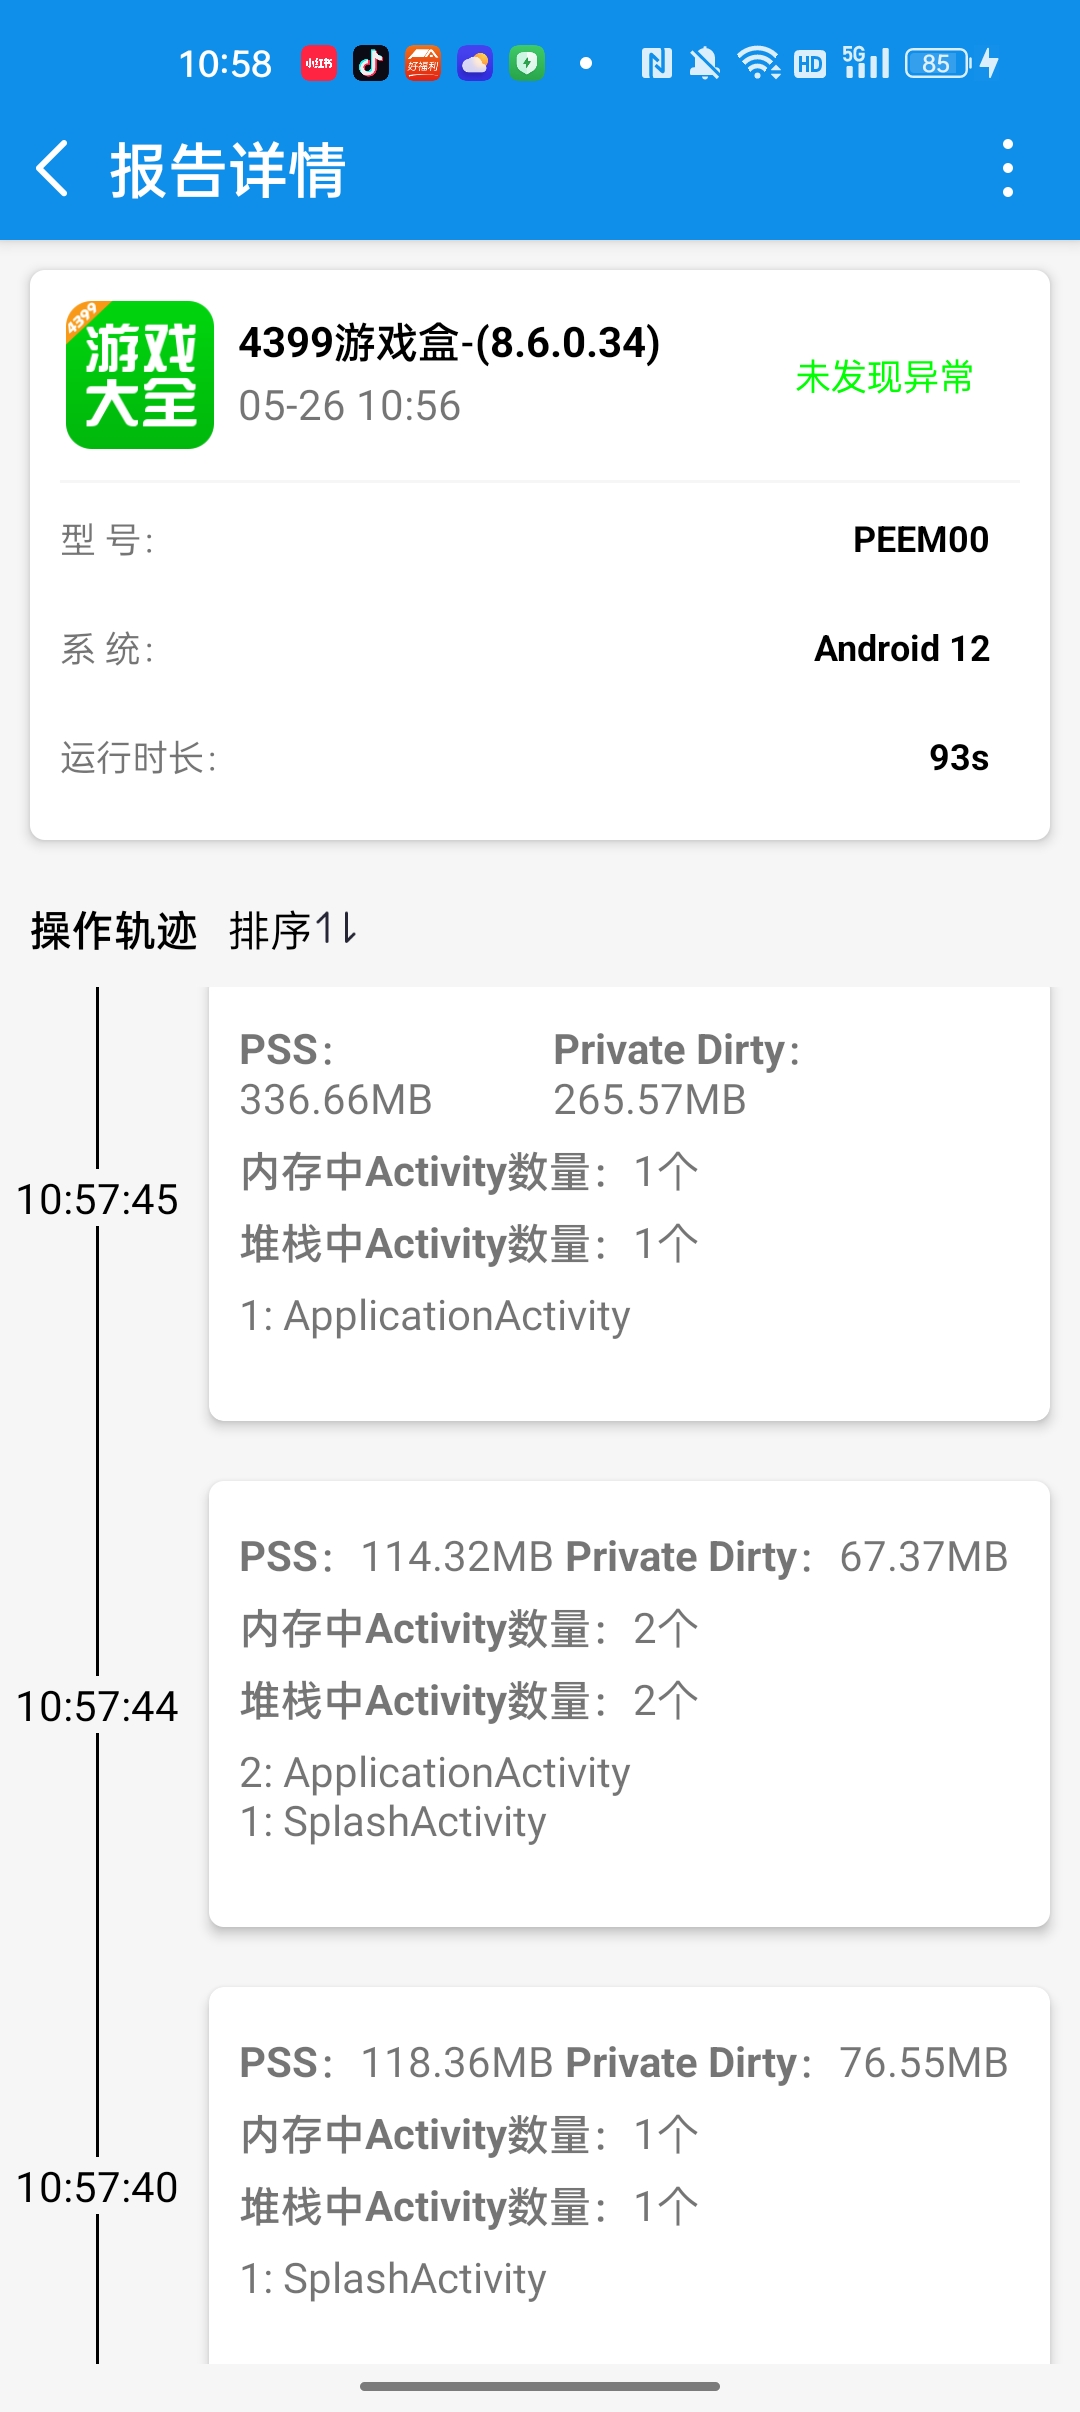
Test sessions, per-sample leak details, and HPROF paths are stored locally, and the report detail screen supports browsing, sharing, or exporting HPROF files.
Testing Scenes
- Watch PSS, Private Dirty, and Activity count changes for an Android app during manual regression testing to catch sustained memory growth early.
- Investigate repeated page navigation, Activity transitions, or back-stack flows by comparing the number of Activities in memory with the number found in the Activity stack.
- Capture an HPROF file at the end of a test session on a debuggable build and use Shark plus LeakCanary to provide heap-analysis evidence for Activity or Fragment leaks.
- Store local test session reports and review per-sample results, share HPROF files, or export them for deeper investigation by developers.
Environment & Requirements
- Platform
- A standalone APK for Android devices, used to monitor a target Android app installed on the same device.
- System Range
- Built with minSdkVersion 21 and targetSdkVersion 35, with compatibility handling for foreground services and overlay window types on Android 8.0 and above.
- Access Path
- After installing and launching the tool on a device, the user selects one installed target app. The tool uses a local ADB connection, defaulting to localhost:5555, and displays live metrics through a floating foreground service.
- Package
- memory_check_v1.1.8.apk
Permissions & Dependencies
- The tool requires permissions for overlay windows, all-files access, notifications, and battery-optimization exemption, and the manifest also declares foreground service, external storage, phone state, and system alert related permissions.
- The device must have ADB debugging enabled and must allow the tool to establish an ADB connection to localhost:5555.
- Automatic HPROF capture and analysis depend on the target app being debuggable. Non-debuggable builds still record memory metrics and Activity count differences.
- The project embeds GreenDAO for local report storage and LeakCanary plus Shark for HPROF analysis.
Support Notes
Explicitly Supported
- The project is an Android app, with build configuration explicitly set to minSdkVersion 21 and targetSdkVersion 35.
- The main workflow requires selecting one installed target app and uses a floating foreground service to show live metrics.
- The code directly invokes dumpsys meminfo, dumpsys activity activities, pidof or ps, run-as kill -10, and am dumpheap -g.
- GreenDAO persists report data, including session summaries, per-sample memory values, Activity counters, stack information, and HPROF paths.
- The report detail screen can share or export HPROF files, and logs are written into the app's external log directory.
Reasonable Inference
- The tool is better aligned with manual testing and regression investigation than unattended continuous monitoring because the core flow depends on app selection, floating-window control, and local report review.
- It is primarily designed for a single-device, single-target workflow because the current UI only allows one target app to be selected at a time.
- When the target app is not debuggable, the report is better treated as suspicious evidence rather than a final conclusion because the automatic HPROF capture and heap-analysis path is not enabled.
- Combines live memory sampling, Activity-difference detection, debuggable-build HPROF capture, and local report management in one on-device workflow.
- Uses ADB shell commands such as dumpsys meminfo, dumpsys activity activities, pidof or ps, and am dumpheap, making the results easy to map back to system-level signals.
- Shows the target app name, PSS, Private Dirty, and Activity counters in a floating foreground-service window, which fits exploratory and hands-on testing.
- Clearly separates debuggable and non-debuggable target capabilities instead of presenting HPROF automation as universally available.
Download & Trust
- Version
- v1.1.8
- Package
- APK
- Size
- 7.2 MB
- Updated
- 2026-05-22
- Download
- Sign in Required
This self-developed tool is built for real Android app QA workflows, runs locally, and does not depend on an external testing platform.